
VIDIA

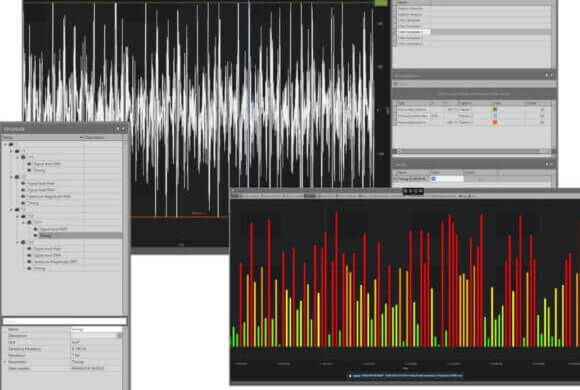
VIDIA is a fully functional tool intended for machine technical condition assessment and diagnostics. Its task is to receive information from measurement devices and gather it in a database. After signal processing and performing of analyses, their results are presented in a legible form. Analyses embedded in VIDIA software enable calculation of the following quantities for a vibration signal:
- root mean square value (RMS),
- peak value (0-p),
- kurtosis,
- crest factor,
- skewness,
- bearing wear index (BWI),
- Bg and Bv coefficients of bearing failure,
- frequency spectrum (resolution of 0.0625 Hz in a full 25.6 kHz band),
- envelope spectrum.
All the parameters are calculated basing on signal time waveforms. This solution ensures the highest precision of the analyses as compared to applications which determine vibration parameters basing on spectrum. Embedded filter design mechanism (AFDTM) enables calculation of all the parameters in an arbitrary, selected by a user, frequency range.
Are you interested in receiving a special offer, or would you like to get more information?
Detectable faults include:
- Imbalance and eccentricity
- Misalignment
- Damage to rolling and plain bearings and their housings
- Oil film instability
- Cavitation
- Looseness of mountings and cracks in structural components
- Damage to gears and belts
- Damage to turbines and fans
- Electrical faults in motors
- Critical speeds, resonances
Original signal waveforms are stored in the database enabling future addition of necessary analyses. Browsing and analysis of data in a mobile form are possible with a separately offered mVIDIA application installed on a smartphone with Android operating system.
Features and capabilities of a software system VIDIA designed for vibration-based machine condition monitoring and analysis
- Historical Measurements Analysis: Includes storage of original time waveforms.
- Standards Compliance: Adheres to standards for vibration-based machine condition assessment.
- Parametric Analyses: Takes into account machine operating conditions.
- Device Communication: Supports direct and indirect communication with measurement devices of stationary systems and portable signal recorders.
- Database: Utilizes MSSQL.
- Architecture: Features a distributed client-server architecture with the option for installation on a single PC-class computer.
- Plant Structure: Accommodates any number of nested levels.
- Statistical Analysis: Analyzes trends in diagnostic parameter values for fault prediction.
- Automatic Alarm Thresholds: Determines alarm thresholds automatically based on historical measurements.
- Chart Templates: Provides templates with zoom, vertical and horizontal markers.
- User Charts: Allows users to create custom charts.
- Chart Notes: Enables adding individual notes to each chart.
- Alarm Window: Propagates exceedance information within the plant structure.
- Flexible Layout: Offers a multi-screen operation with a flexible program layout.
VIDIA is an innovative model for implementing predictive maintenance methods in industrial facilities
The plant structure and analyses that best assess the technical condition of individual machines and their components, along with alarm definitions, are created by an expert. After training on program operation and the basics of vibration diagnostics, the expert can remotely support the maintenance staff during the initial period. This ensures effective use of the tool, acquisition of knowledge, and development of practical skills under the guidance of a specialist, as well as increased safety of monitored equipment from the first days of system deployment.
There are many programs for assessing the technical condition of machines and diagnosing their faults. Are they easy to use? How well do they meet the real needs of the people who rely on them as a primary work tool? What support can someone tasked with minimizing production and maintenance costs receive? Our answer to these questions is the VIDIA program.
Nearly twenty years of experience in developing software for machine condition analysis, insightful observation of changing customer needs, and the possibilities offered by the latest technologies have given rise to the entirely new VIDIA program.
In small plants, the VIDIA program is typically installed on a PC-class computer. In international enterprises, its components are distributed across servers to form a remote diagnostics center. The unique method of collecting measurement information allows data to be gathered from devices permanently installed in remote production plants (DiBOX, HEV-i, COBAD). Additionally, data recorded by portable measurement devices like WiViD, widely used by service technicians, can be sent to the database. Furthermore, digital vibration sensors such as CL@VE which are mounted directly on the machines, also contribute to the data collection.
Using a client-server architecture based on several services, the program offers remote access to measurement devices as well as measurement and analysis results. Aligning with current trends, VIDIA can act as a distribution center for monitoring the technical condition of machines.
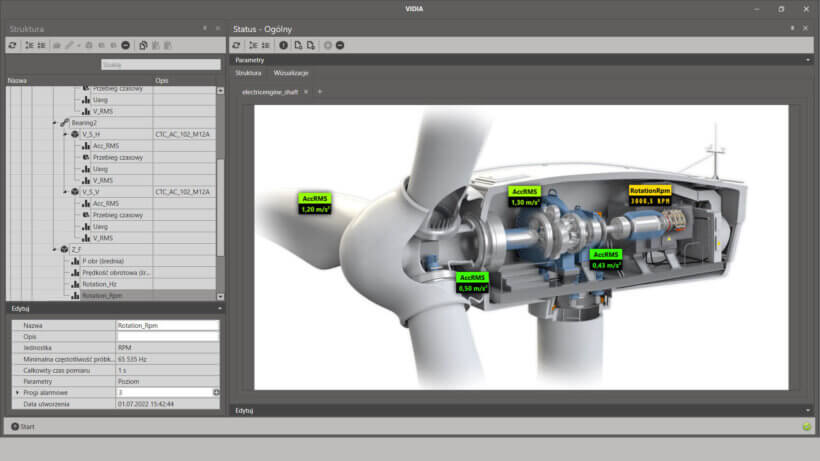
The examined machine elements are placed in a plant structure, which you can freely create. In mobile devices, it becomes a measurement route. The current technical condition of individual components propagates up the structure, facilitating navigation. Analysis wizards assist in adding analyses. An innovation of the program is the storage of original time waveforms of the recorded vibration signals. Thanks to this, new analyses can be defined even after measurements are completed.
The analyses embedded in VIDIA allow for the determination of, among others, the root mean square value (RMS), peak value (0-p), peak-to-peak value (P-P), kurtosis, crest factor, skewness, bearing wear index (BWI), Bg and Bv coefficients of bearing failure, gE coefficient (envelope RMS of acceleration), frequency spectrum (resolution of 0.0625 Hz in a full 25.6 kHz band), envelope spectrum. The built-in dynamic filter design mechanism (AFDTM) allows for the determination of all the mentioned parameters in any frequency range specified by the user.
Using the presented set of analyses, one can assess the technical condition and diagnose faults in: bearings, gearboxes (geared, belt), motors, pumps, turbines, compressors, fans, as well as structural components. The detected faults include:
- Imbalance and eccentricity
- Misalignment
- Damage to rolling and plain bearings and their housings
- Oil film instability
- Cavitation
- Looseness of mountings and cracks in structural components
- Damage to gears and belts
- Damage to turbines and fans
- Electrical faults in motors
- Critical speeds, resonances
The program introduces a completely new model for the implementation of predictive maintenance methods. The plant structure and analyses that best assess the technical condition of individual machines and their components can be created by an expert. After conducting training on program operation and the basics of vibration diagnostics, the expert can remotely support the maintenance staff during the initial period. This ensures the effective use of the tool, acquisition of knowledge, and development of practical skills under the guidance of a specialist, as well as increased safety of monitored equipment from the first days of system deployment.
The charts created to present analysis results are saved as user charts or templates, which can be utilized during the analysis of new measurement data. For a single analysis (e.g., vibration spectrum), any number of chart configurations can be saved. This eliminates the need to waste time searching for characteristic fault frequencies, inserting, and describing markers. You can enter your conclusions directly into each chart’s window, and the program will remember and store them in the database.
- Measurement route mode and independent measurement
- Storing measurement information in a database (Microsoft SQL Server)
- Automatic saving of measurement source data (time waveform in measurement unit)
- Remote access to source data and analysis results (WebAPI)
- Performing any analysis on historical data (provided acquisition signal parameters are compatible)
- Propagation of analysis status in the location tree
- Automatic re-measurement (mVIDIA)
- Sensor database with their parameters
- Measurement device database with their parameters and last configuration
- Point temperature measurement during vibration measurement (mVIDIA)
- Recording thermal images (mVIDIA)
- Built-in emissivity database (mVIDIA)
- Broadband vibration level analysis: RMS point estimates, true 0-p, true p-p, accelerations, velocities, displacements
- Determination of statistical signal parameters: crest factor, kurtosis, skewness
- Extraction of a segment of the time waveform for non-stationary signal analysis
- Ability to define up to 4 alarm thresholds for point estimates
- Signal analysis capability in any frequency range with error minimization function – built-in Dynamic Filter Parameter Estimation (DFPE TM) mechanism for dynamic digital filter parameter determination
- Point estimates of bearing condition assessment: Bg, Bv, BWITM (Bearing Wear Indicator), gE (RMS value of vibration acceleration envelope)
- Signal spectrum analysis (values: RMS, 0-p, p-p, phase) in any frequency range, up to 400,000 lines
- Envelope spectrum analysis
- Creation of analysis chart templates and user charts (VIDIA)
- Export of measurement and analysis results to a text file
- Analysis set wizard for screw compressors and roots blowers
- Analysis set wizard for gearboxes
- Statistical analysis of trends in diagnostic parameter levels
- Automatic determination of warning thresholds based on measurement history